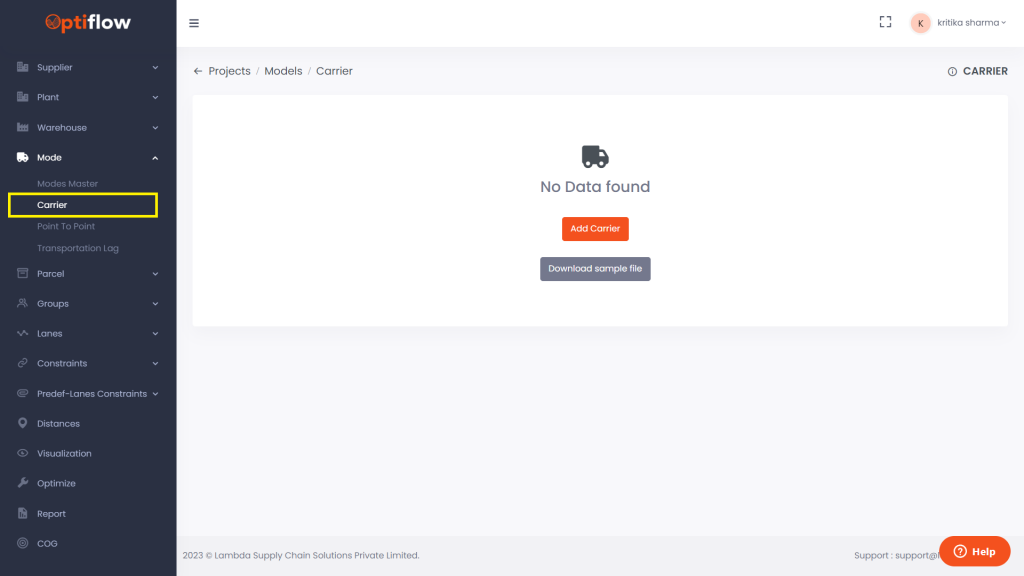
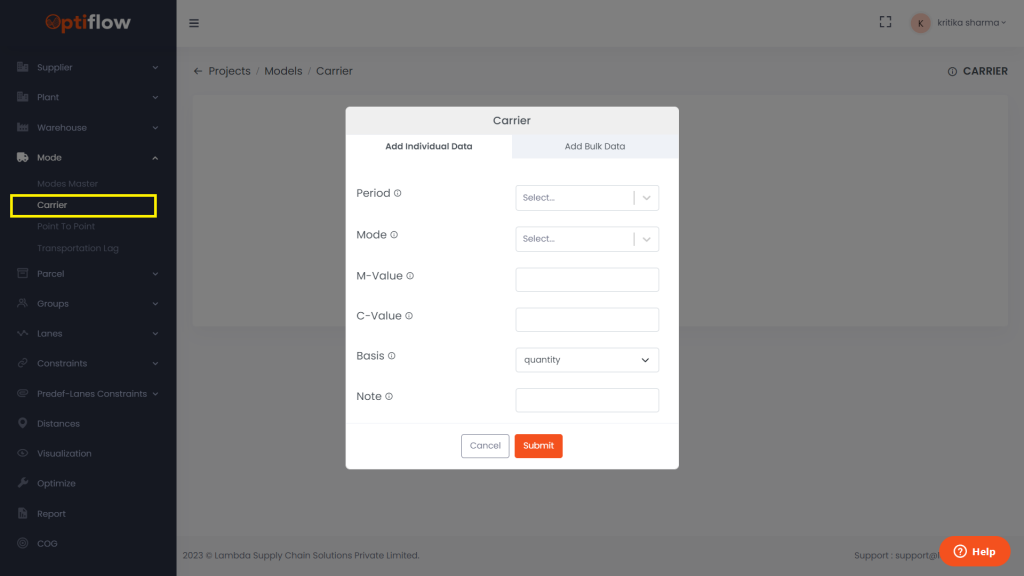
The Carrier table is employed to delineate various carrier modes, encompassing types such as truckloads, shiploads, rail loads, and others.
The mode can be specified, and utilizing the available data for that mode, we can generate a regression curve for the values of M (slope) and C (intercept). Basis field can be either “Weight” or “Quantity” depending upon whether we have taken rate per unit weight or quantity for generating regression curve.
Example: We have this given dataset with Origin, Destination, Weight, Distance and Rate.
We can calculate the Rate per unit weight
The regression curve has been established between Rate per unit weight and distance for the provided dataset, yielding values of M = 0.0002 and C = 0.263 as determined from the resultant equation.


